Table of Contents
The term ‘population growth’ refers to the change in the number of individuals in a population with time. It refers to how the number of individuals in a population increases or decreases with time.
Population growth- Introduction:
Change in population is determined by four factors: birth, death, emigration and immigration.
In a closed population, change in population is only related to birth and death of individuals.
In case of open population, birth, death, immigration and emigration result in a change of population.

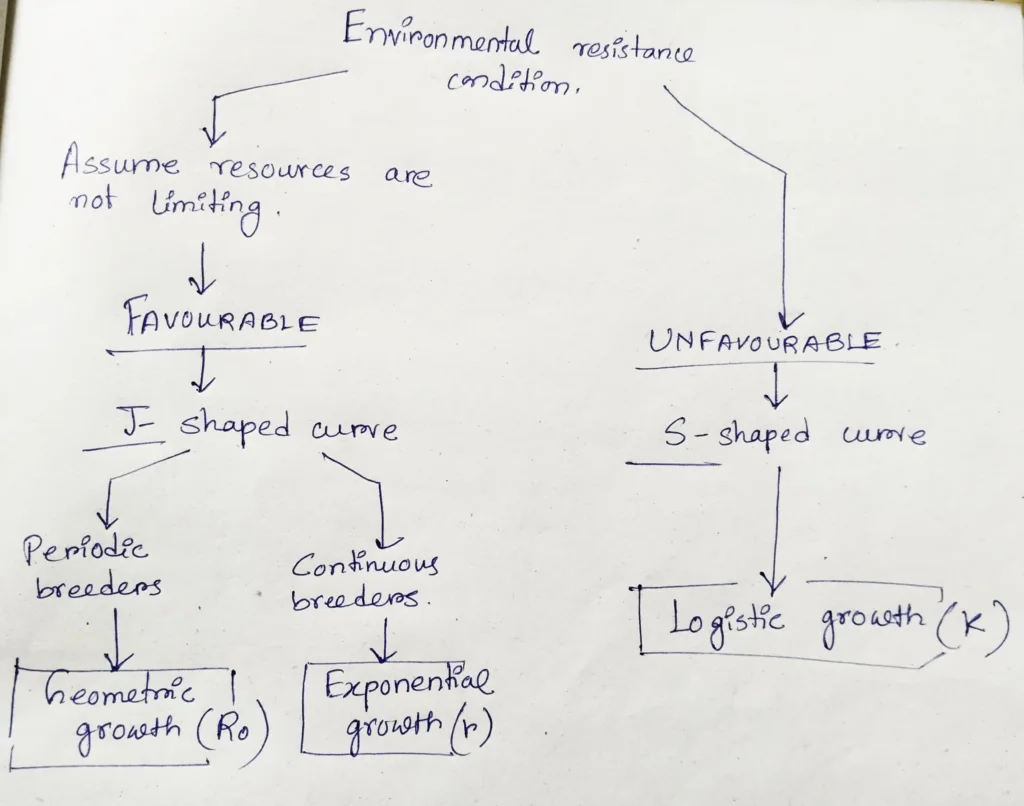
There are two types of environmental resistance conditions. One is favorable (unlimited resources) and the other one is unfavorable. Under favorable condition there are two types of growth- 1) geometric growth, 2) Exponential growth. Under unfavorable condition there is logistic growth.

Geometric growth:
- Geometric growth describes population growth for periodic breeders.
- It is seen in annual breeder, insects, large plants, sheep, goats and horses etc.
- The population increases by a constant proportion: the number of individuals added is larger with each time period.
- Growth is constant and can be determined by comparing the population size in one year to the population size at the same time the previous year.
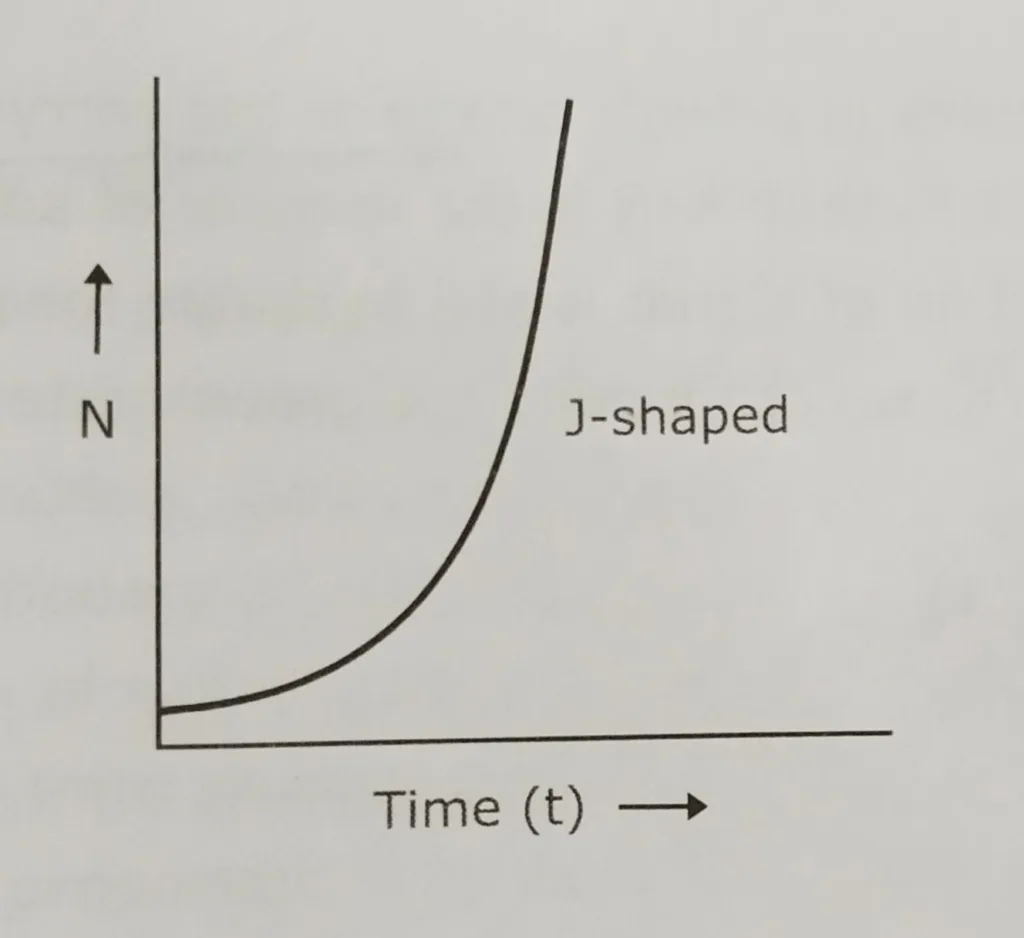
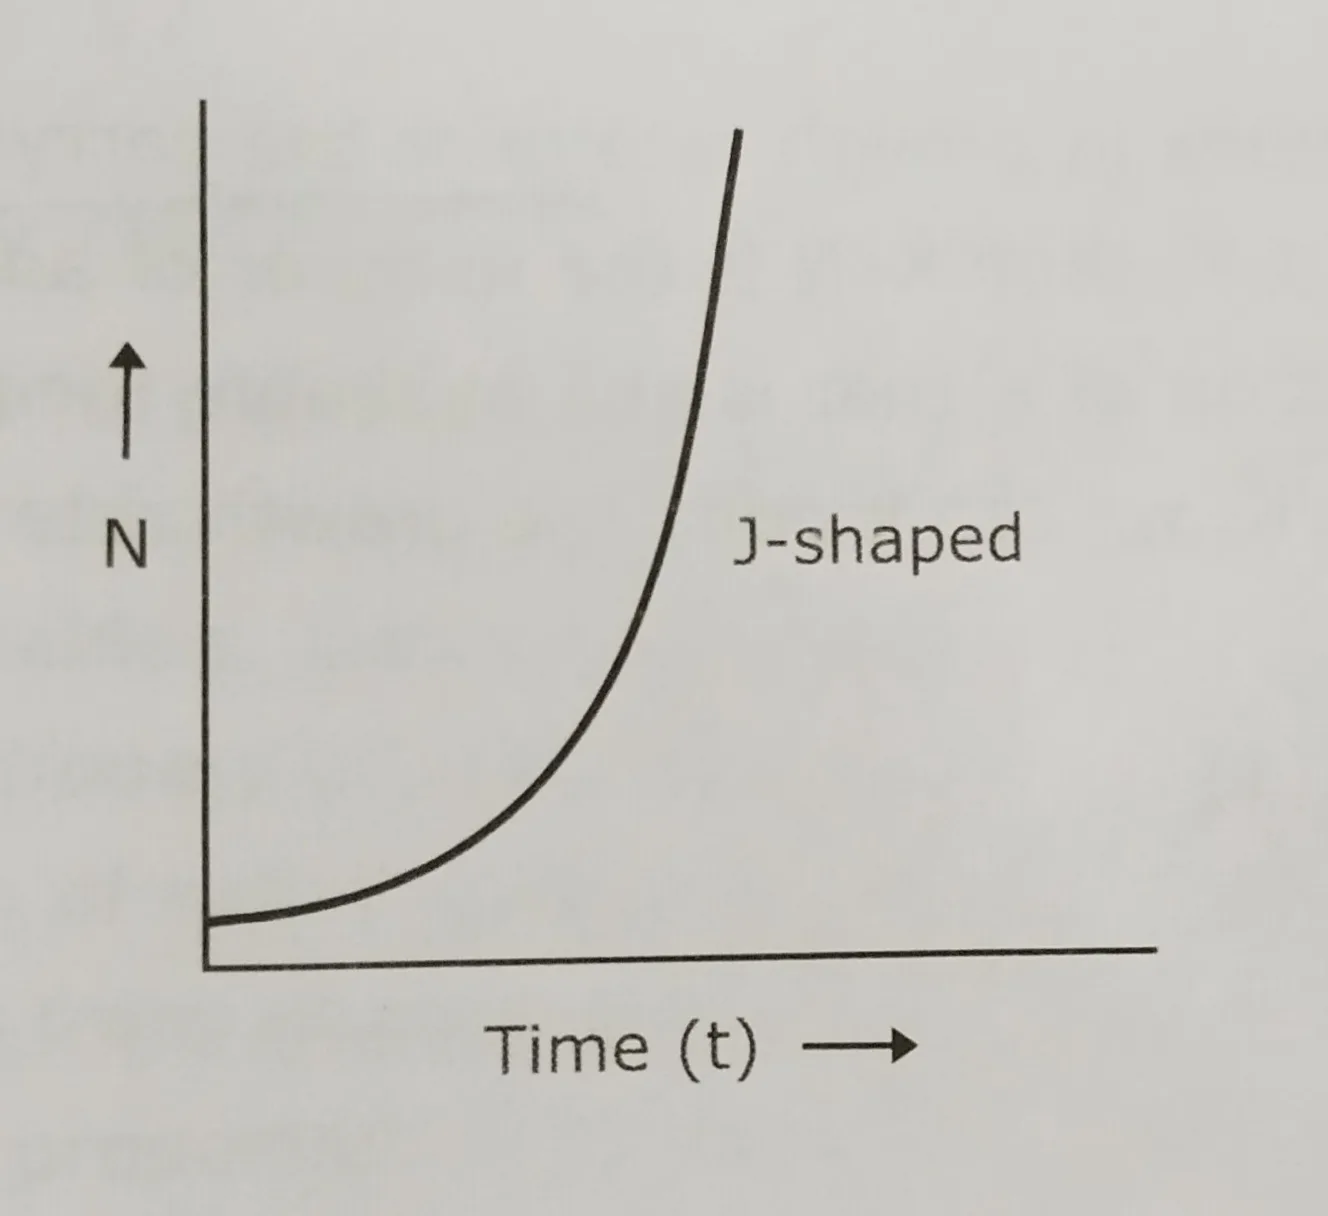
- Results in J-shaped curve.

Net reproductive rate (R0):
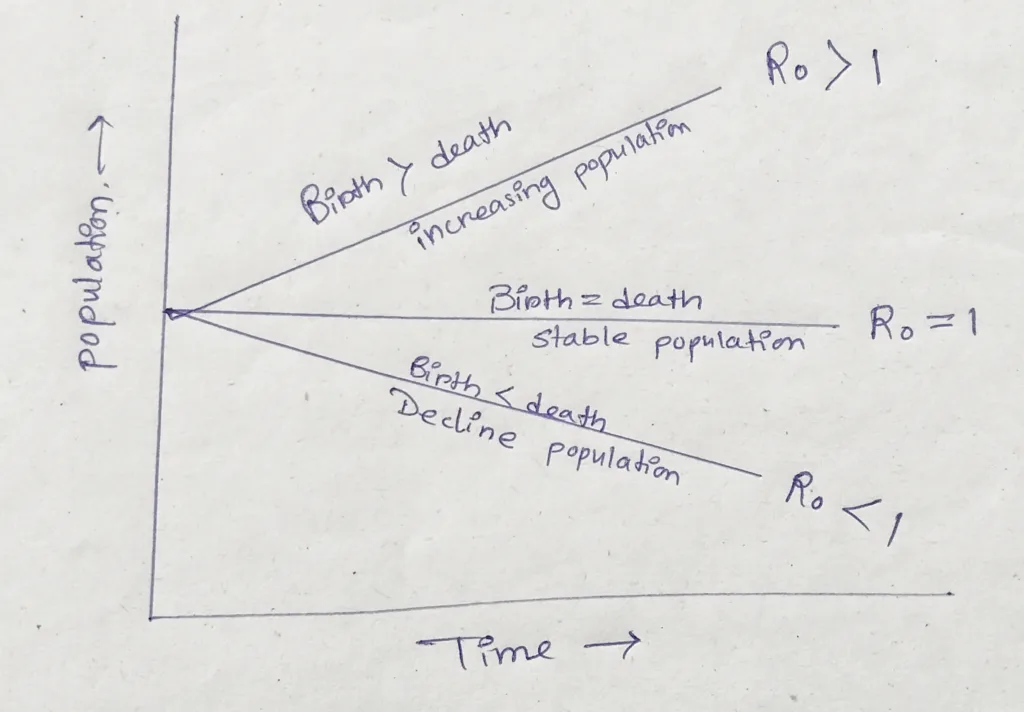
The average number of offspring that a female produces during her lifetime is called the net reproductive rate (R0).

Populations decline, when R0 or λ <1
Population at equilibrium, when R0 or λ =1
Geometric growth formula:
Nt=N0Rt0
Where,
t= number of generations
N0= initial number of population
Nt= final population after given time
The finite rate of increase, λ, is the ration of the population size from one year to the next, calculated as
λ = N1/N0
Nt = N0 λt
t= a number of time intervals.
What is the difference between R0 and λ?
- R0 represents the net reproductive rate per generation.
- λ represents the finite rate of population change over some time interval, often a year.
- Nt=N0Rt0, where t= a number of generations
- Nt = N0 λt, where t= a number of time intervals
Populations grow, when R0 or λ >1
Populations decline, when R0 or λ <1
Population at equilibrium, when R0 or λ =1
Other related notes:
- Lotka-Volterra model: https://thebiologyislove.com/lotka-volterra-model/
Facebook link: https://www.facebook.com/share/p/yHj2h2JPcxRP3y3y/?mibextid=oFDknk
Instagram link: https://www.instagram.com/p/C7Ccbpfybfx/?igsh=aDc5YjluYzFuazBu

