
Table of Contents
Survivorship curves are the graphical representation of the number of individuals alive in a population at various ages. These curves are graphs that show what fraction of a population survives from one age to the next. Population rate depends on many factors like- mortality, natality, immigration, emigration etc.
Types of Survivorship curves:
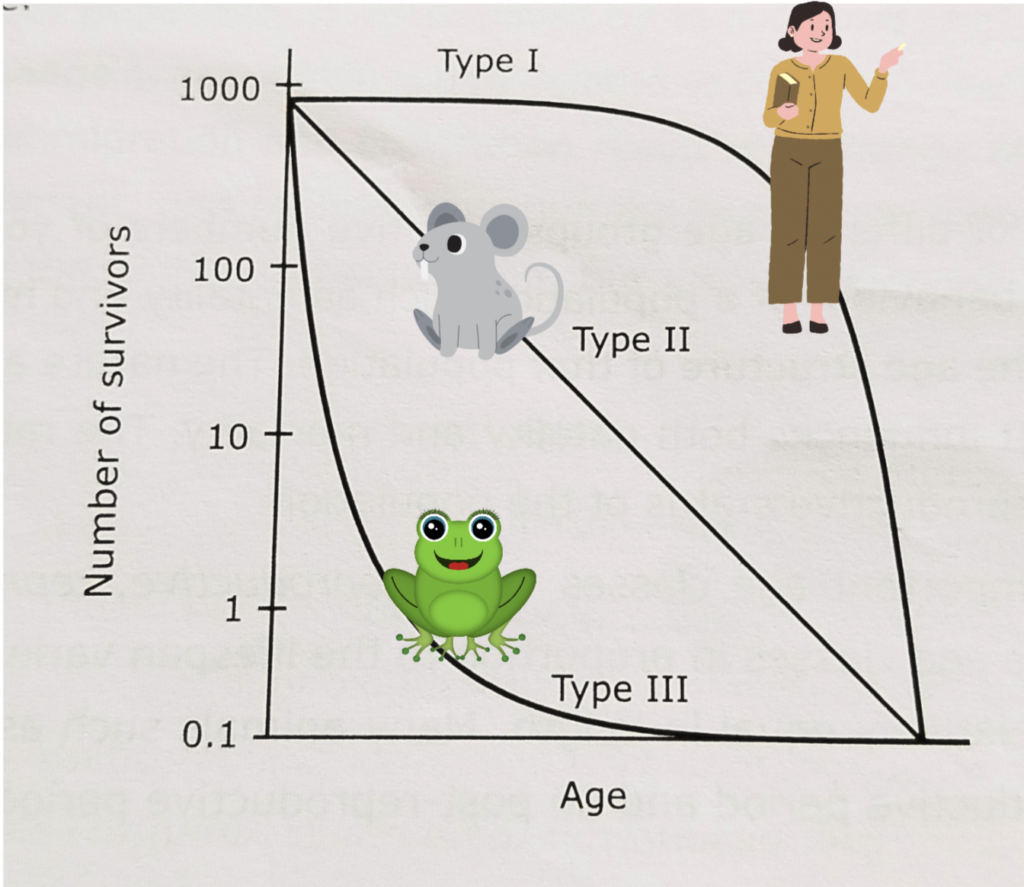
These curves are of three general types: 1) Type 1 survivorship curve (highly convex curve), 2) Type 2 survivorship curve (diagonal curve), 3) Type 3 survivorship curve (highly concave curve),
Type 1 survivorship curve: (Highly convex curve)
- Rate of loss for juveniles is relatively low (high survival at early age).
- High age-specific survival probability in early age and middle life.
- Most individuals are lost later in life, as they become older and more prone to sickness and predators (mortality high at later age).
- Have relatively few offspring but invest much time and resources in raising their young. High parental care.
- Many large mammals including humans, exhibit type I curves.
- Species are iteroparous (organism breed several times during the course of their life span).
- Examples: Humans and large animals like deer, sheep, mango tree etc.
Type 2 survivorship curve: (Diagonal curve)
- This is an intermediate between Types 1 and 3 curves.
- Individuals die at a constant rate.
- Roughly constant mortality probability is experienced regardless of age.
- Examples: Small mammals, song birds, reptiles, American robin, lizards, mice, rodents and some annual plants.
Type 3 survivorship curve: (Highly concave curve)
- Most of the Juveniles die or are eaten, but a few reach a favorable habitat and thrive.
- Rate of loss for juveniles is relatively high (high mortality/death rate at early age).
- These curve flattens out for those organisms that have avoided early death (decreased mortality low at later age)
- Have relatively high numbers of offspring but invest no time and resources in raising their young. (low/no parental care).
- Many fish and marine invertebrates fit this pattern.
- These organisms breed once during their lifetime and termed as semelparous.
- Examples: Barnacles, many trees, frogs, and insects, oysters etc.
Diagram of three types of survivorship curve:
Other related notes:
- Lotka-Volterra model: https://thebiologyislove.com/lotka-volterra-model/
- Population growth- Exponential growth: https://thebiologyislove.com/population-growth-exponential-growth/
- Population growth- Geometrical growth: https://thebiologyislove.com/population-growth-geometric-growth/
Facebook link: https://www.facebook.com/share/p/TvopF24w3GZKpTJX/?mibextid=oFDknk
Instagram Link: https://www.instagram.com/p/C7n2KUKRXnr/?igsh=YTV6eHI0bWdsOGRq